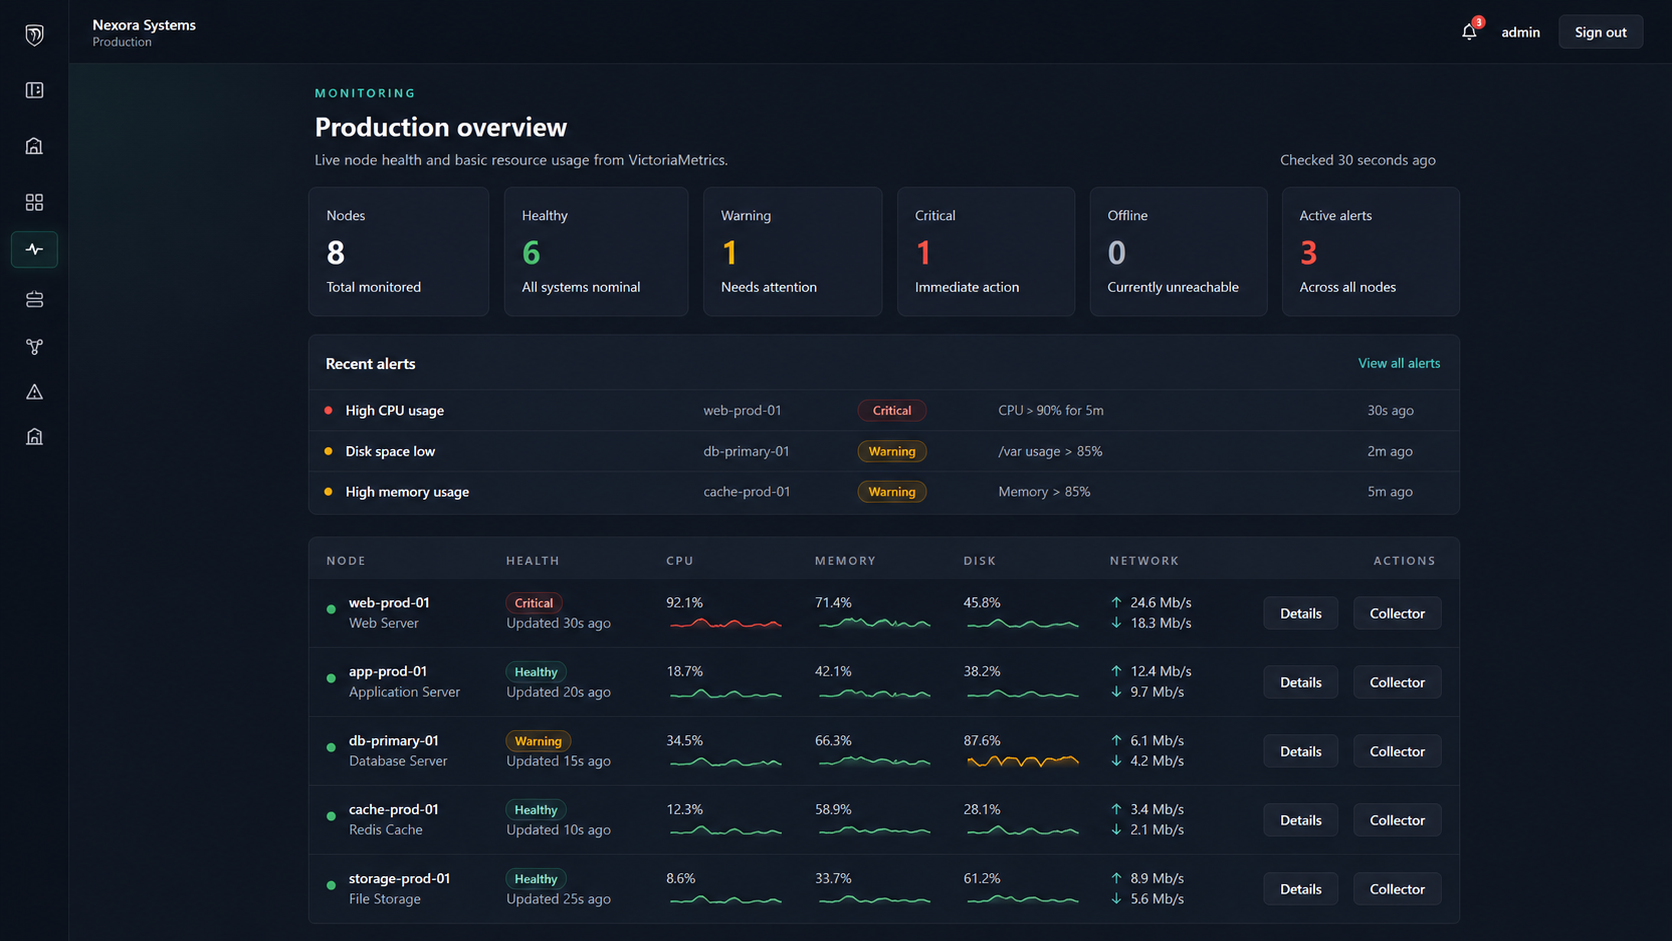
CPU, memory, disk, and network health.
Time-series metrics are kept outside PostgreSQL and queried with tenant-safe account and node labels.


Overseer security monitoring
Overseer gives small and growing businesses an account-scoped view of equipment, networks, telemetry, endpoint posture, software policy, and alerts. It is already used in production for Elisk clients, with a public subscription SaaS opening planned for early 2027.
Monitoring with intent
Overseer is designed around scoped collection. Some environments only need basic resource telemetry. Others need endpoint inventory, active sessions, exposed ports, software policy, or network-edge visibility. The collection profile should match the operational question being answered.
Time-series metrics are kept outside PostgreSQL and queried with tenant-safe account and node labels.
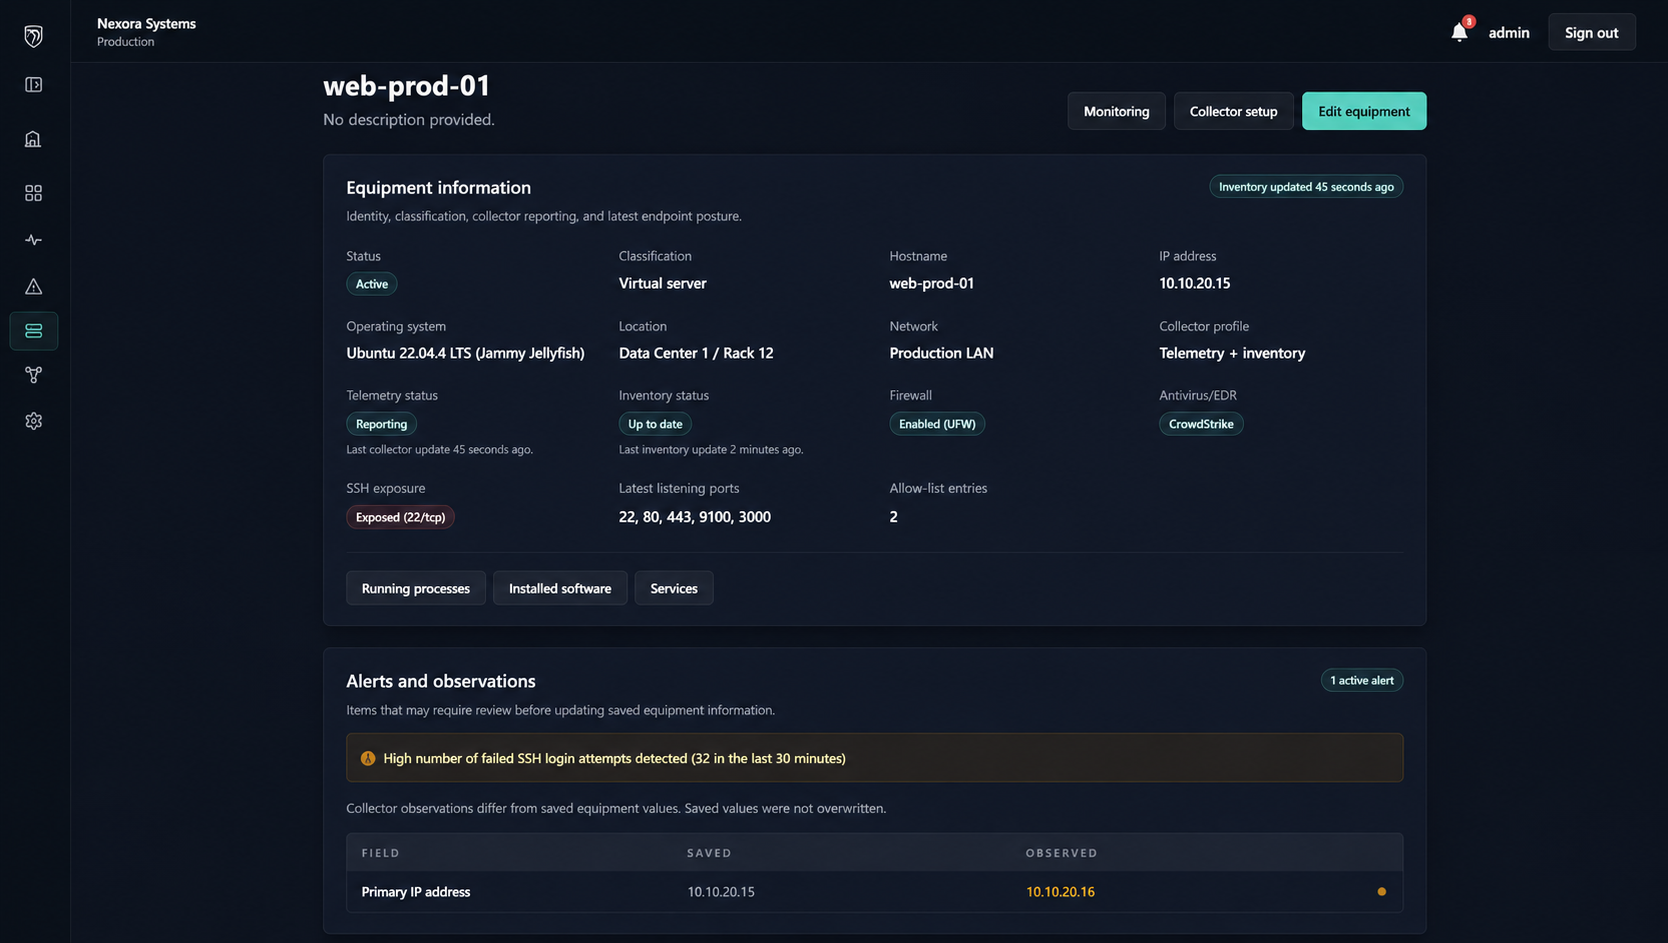
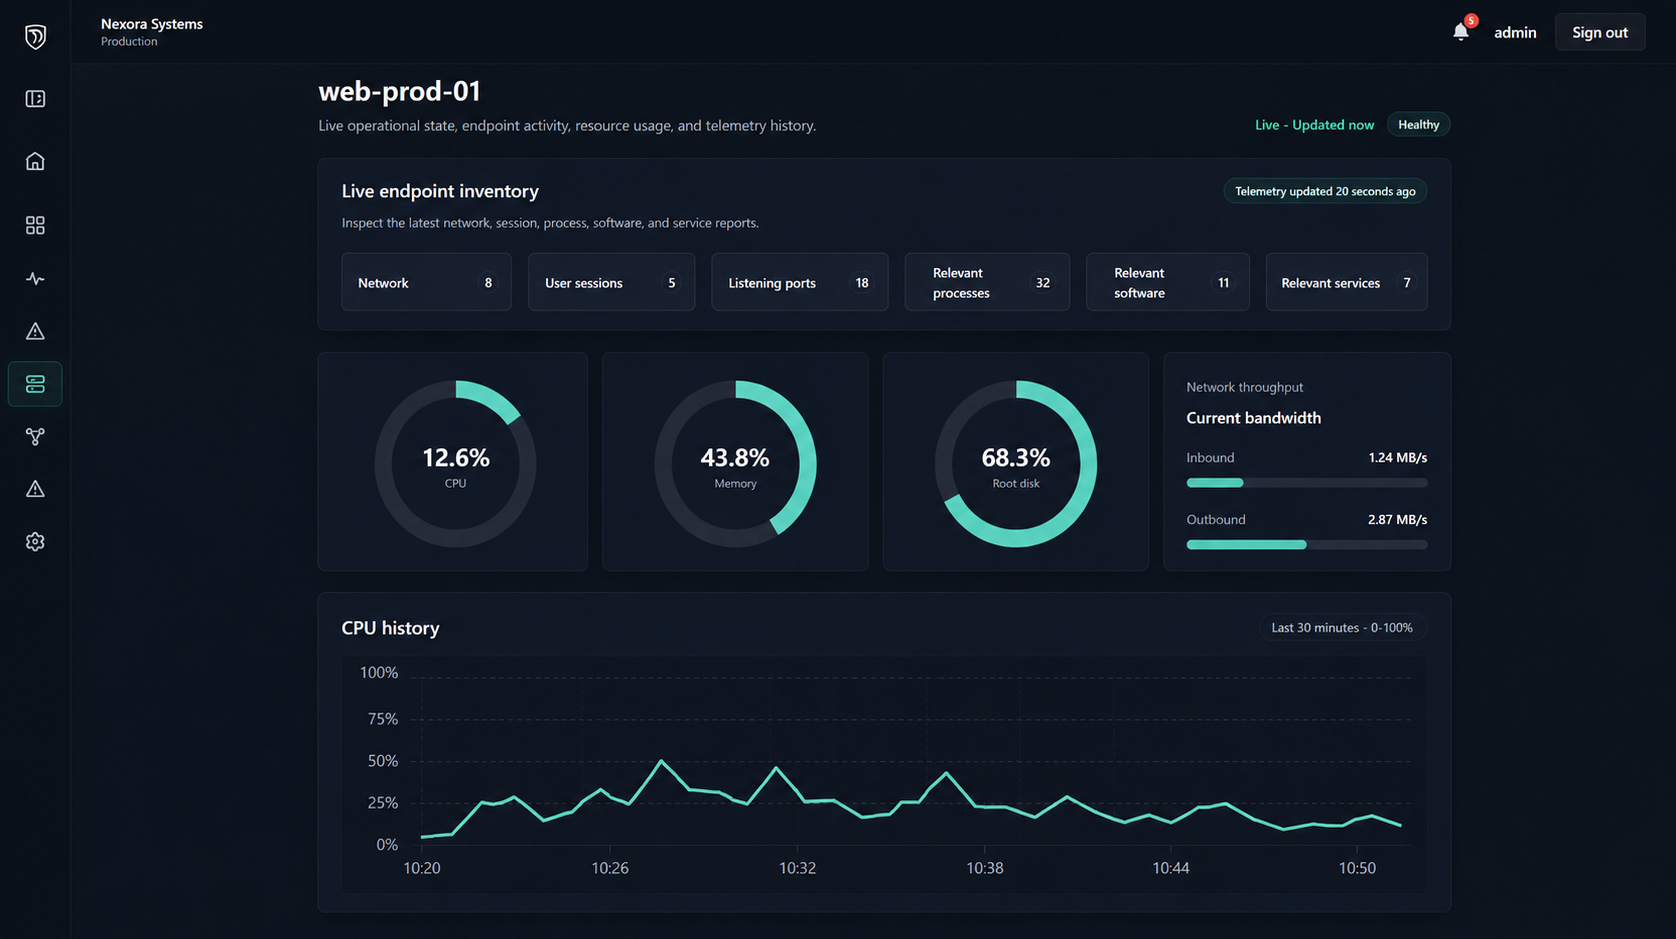
Linux inventory is normalized into latest-state views, with searchable full process, software, and service pages when deeper review is needed.
Software policies and allow lists turn inventory into reviewable findings and durable alerts.
Network visibility can be built through Elisk Gateway hardware or prepared OPNsense routers, tying edge state back to monitored systems.
Collection model
Overseer is built around the managed Elisk Overseer Client for production deployments, while keeping support for established open-source telemetry and inventory components. Telegraf handles numeric resource telemetry, osquery reports host state, and Vector ships bounded inventory batches when that depth is enabled.
Operator view
Overseer keeps the live view focused on what an operator can act on: telemetry freshness, resource pressure, open alerts, exposed ports, current sessions, relevant processes, installed software, and services. Equipment records can be enriched from trusted observations without overwriting human ownership data silently.
Open, acknowledged, and resolved states preserve the review trail instead of treating alerts as disposable dashboard noise.
Account and node ownership are derived from trusted records, not from client-submitted labels or hidden form state.
Access and retention
Overseer is currently available to Elisk clients as part of managed security and infrastructure work. Public subscription access is planned for early 2027, after the operating model, onboarding, and retention controls are ready for self-service use.
Data is retained for the period the customer needs. The default operational window is 30 days, with retention adjusted for monitoring goals, risk posture, storage cost, and compliance expectations.
Start with visibility
Tell us what you operate, what you need to monitor, and how much endpoint or network detail is appropriate. We will scope the collection path around the risk instead of defaulting to maximum data capture.